


 91 / 104

1,271
425
685
97
–92
RECURRING
OPERATING INCOME
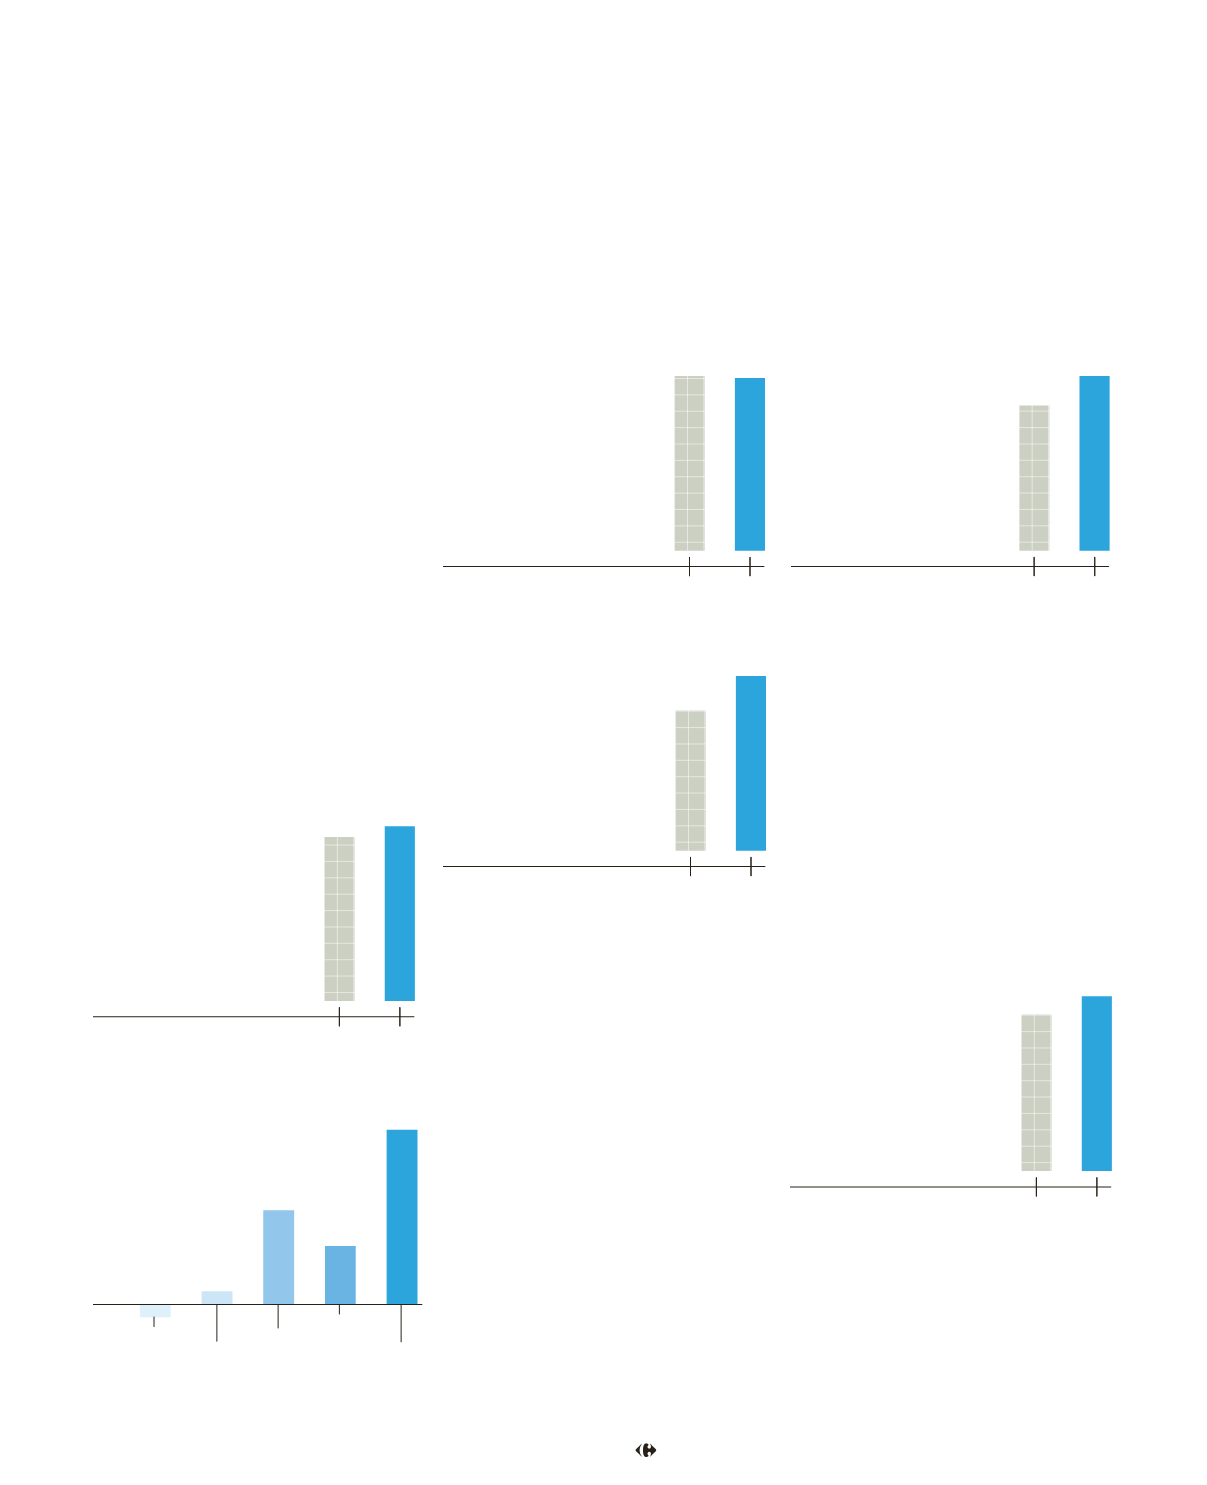
Recurring operating income rose by
10.6% at constant exchange rates
(+6.7% at current exchange rates) to
€2,387 million. This represented 3.2%
of sales, as compared to 3.0% in 2013.
In France, recurring operating income
continued to improve and was up 6.1%.
The gross margin continued to benefit
from a better balance between low
prices, promotions and loyalty pro-
gramme, as well as savings related to
reduced shrinkage and the implemen-
tation of the plan to revamp the supply
chain. Profits in the other European
countries increased by 9.6%at constant
exchange rates. Recurring operating
income in emerging markets was up by
14.9% at constant exchange rates.
Profitability continued to grow in Brazil
in each of the formats. In Argentina,
recurring operating income was stable,
demonstrating excellent resilience. In
Asia, the commercial margin held up
well in an environment marked by a fru-
gal consumption environment and a
drop in sales of shopping cards. Activity
in Taiwan was robust.
NET INCOME, GROUPSHARE
Net income, Group share decreased by
1.5% compared with 2013 at constant
exchange rates (by 1.1% at current
exchange rates) to €1,249 million. Net
income from recurring operations, Group
share was €1,182million, an increase of
24.6% compared with 2013.
NETDEBT
Net debt stood at €4,954 million in
2014. Net interest expense continued
to fall, and was down by €29 million
compared with 2013. The net debt
to EBITDA ratio was 1.3x (1.1x in 2013).
INVESTMENTS
Carrefour continued its investments in
2014, in line with its plans: investments
grew by 11.7% and reached €2.4 billion
in the year. The investments allow
Carrefour to continue store renovations
andmaintenancework, notably in France
and Brazil, to rationalise IT systems and
to develop its multi-channel offer.
2,238
2,387
2013 2014
1,263
1,249
2013 2014
4,117
4,954
2013 2014
2,159
2,411
2013 2014
949
1,182
2013 2014
Net income from
recurring operations,
Group share
(in €M)
France
Other
countries
inEurope
Latin
America
Asia
Global
functions
Recurring
operating income
by geographic region
(in €M)
Recurring
operating income
(in €M)
Net income,
Group share
(in €M)
Net debt
(in €M)
Investments
(in €M)
91
2014 annual activity and responsible commitment report –